qq-plot is short for quantile-by-quantile plot. You plot one quantile against another and you see if their coordinate pairs form a straight line. One of the quantiles is your sample observations placed in ascending order. For example, you take the height of 30 people and place them in order from smallest to largest. That will be your y-axis values. The other quantile will be the quantiles of a probability distribution that you believe your sample may have come from. For example, you may think your heights are Normally distributed. So your x-axis values would be the quantiles of a standard Normal distribution. Since you have 30 heights, you’ll need 30 Normal quantiles. The way that’s done is to find the quantiles for \( \frac{1}{31} , \frac{2}{31} ,\dots, \frac{30}{31} \). In other words you solve for z in \( P(Z \le z) = \frac{1}{30}\). That turns out to be -1.85. And then you do the same for all the fractions. Finally you plot your heights versus the z-values and see if they’re in a somewhat straight line. If they are, then you can be pretty safe in your assumption that your sample comes from a Normal distribution.
For Normal distributions this can be made intuitive by recalling the standard Normal transformation: \( z = \frac{x-\mu}{\sigma}\). That’s the formula we use to create z-scores, which allow us to use the standard normal distribution to find probabilities. Solving for x we get \( x = z\sigma + \mu\). You may notice that looks just like the formula for a straight line but with different variables. Remember this one from algebra? \( y = mx + b\). That’s what we have but with the mean (\( \mu\)) serving as the intercept and the standard deviation (\( \sigma\)) as the slope. And instead of y and x, we have x and z. If we wanted to make a straight line, we would plug in our z-values into \( x = z\sigma + \mu\) and find our x values. That would give us a set of coordinate pairs that we could plot and then connect the dots to make a straight line.
Now of course we don’t know \( \mu\) and \( \sigma\). We have to estimate them from our sample. Furthermore we don’t know if our sample came from a Normal distribution. But when constructing a Normal qq-plot, we assume our sample did come from a Normal distribution. We have our straight line formula \( x = z\sigma + \mu\) and our x values. If our x values came from a Normal distribution, then they would have corresponding z-scores. We don’t know what they are (because we don’t know \( \mu\) and \( \sigma\)), but we can estimate them with the quantiles of a standard normal distribution, with the number of quantiles equal to our sample size. Let’s do this in R. We’ll generate a random sample of 30 observations from a Normal distribution with mean = 10 and standard deviation = 2.
# generate random sample from N(10,2)
x <- sort(rnorm(30,10,2))
k <- (1:30)/31
z <- qnorm(k)
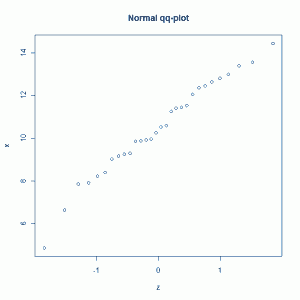
plot(z,x,main='Normal qq-plot')
That gives us the following plot:
The points look like they're on a straight line, as they should. R has a built in function for this called qqnorm. All you have to do is type:
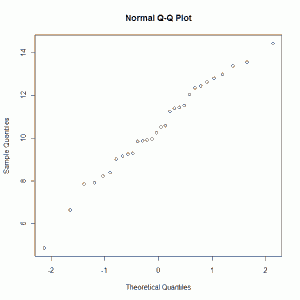
qqnorm(x)
And you get:
Which looks like what we did the first time but with axis labels.
If we want we can draw a straight line through the plot to help us gauge just how close to a straight line the points lie. One choice is to draw the least-squares line. Another is to use the formula \( x = z\sigma + \mu\) using our mean and standard deviation estimates for \( \mu\) and \( \sigma\) . In other words plot the line \( x = zs + \overline{x}\). Let's do both:
# create qq-plot with straight lines
par(mfrow=c(1,2))
plot(z,x,main='Normal qq-plot')
abline(lm(x~z)) # draw best fitting line
plot(z,x,main='Normal qq-plot')
abline(a=mean(x),b=sd(x)) # draw line with slope = std dev and intercept = x-bar
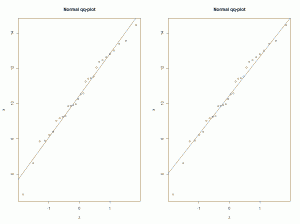
Here's the plot:
It's really hard to tell the difference between the two, but the points seem to lie pretty close to both straight lines.
So that's how Normal qq-plots work. But keep in mind that qq-plots are not just for assessing Normality. You can assess whether or not a sample came from, say, a chi-square distribution or a gamma distribution. Let's generate 30 points from a chi-square distribution with 4 degrees of freedom, and then construct two qq-plots: one with chi-square quantiles and the other with Normal quantiles.
# generate random sample from chi-sq(df=4)
c <- sort(rchisq(30,df=4))
# compare normal and chi-square qq-plots
k <- (1:30)/31
q <- qnorm(k)
cq <- qchisq(k,df=4)
par(mfrow=c(1,2))
plot(cq,c,main='chi-square qq-plot')
abline(lm(c~cq)) # draw best fitting line
plot(q,c,main='Normal qq-plot')
abline(lm(c~q)) # draw best fitting line
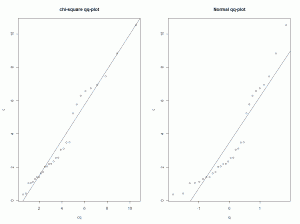
This gives us the following plots:
We see in the left plot our two quantiles lying pretty close to a straight line. They should. That's the chi-square qq-plot and our data are from a chi-square distribution. On the right however we see a fit that's not so good, especially in the extremes. That's our Normal qq-plot. Since our data come from a chi-square distribution, which is skewed right, it makes sense that the Normal qq-plot would show large deviations from a straight line in the "tails" of the plot.


I’ve been Googling a lot and finally a post that gives intelligible sense into qq plot. Thank you.