When doing linear modelling, we make certain assumptions about the data. One such assumption is uniform variance. The fancy word for that is homoscedasticity. It means the variance around a regression line is roughly the same for all values of the predictor variable. One way to check that assumption is to fit a linear model and produce a scatterplot of residuals versus the predictor variable. If the data are homoscedastic then we should see no pattern in the scatter plot. They should fall in a uniform random pattern around 0. If there is a pattern, then our assumption of homoscedasticity is wrong and that’s a bad thing. Fortunately there is something we can do about it: transform the data. If you’re uncomfortable with the idea of transforming data, then just think of transforming inches to centimeters or Fahrenheit to Celsius. That’s the same thing. We apply a formula (or more technically, a function) to each data point and transform the data to a new scale. Then we re-do our regression analysis with the transformed data and hopefully see a nice uniform scatter of residuals versus the predictor.
But how do we transform the data? There are plenty of options. We can take the natural log of the response. Or we can take the square root or inverse square root. Or we can square it or cube it. We can even take the inverse-arcsine. So which option do you pick? You can use trial and error. Pick a handful of transformations and see which works best. Or just do a log transformation. That’s a pretty safe bet to at least improve the residual variance. Yes, but this is math and statistics and we want to be efficient! We want a systematic way to pick the “best” transformation. Well, I can’t say that I blame you. So here’s one way to systematically find the “best” transformation (as long as all the response data are positive).
First, we use the standardized Box-Cox Transformation:
$$ t_{\lambda}(Y_{i})=\frac{Y_{i}^{\lambda}-1}{\lambda \dot{Y}^{\lambda – 1}}$$
where \( \dot{Y}\) is the geometric mean of the response variable. That is \( \dot{Y}=(\prod_{i=1}^{n}Y_{i})^{1/n}\). So what we do is find the geometric mean of our untransformed response data, then use that in the standardized Box-Cox formula above with a specific lambda value, usually ranging from -2 to 2. That gives transformed response data which we then regress against our predictor. We make note of our Sum of Squares Error and then start over with a new value of lambda. The lambda that leads to the lowest Sum of Squares Error is declared our “best” transformation. For example, if lambda=0.5 gave us the lowest SSE, then we would transform our data using a square-root transformation.
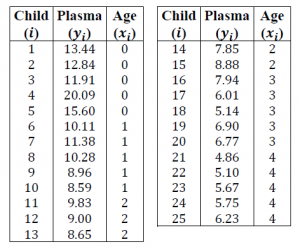
Let’s do a real-life example (or at least something that sounds like real-life). In a medical study, researchers collected measurements from 25 young children. Of interest is the dependency of the “plasma level of a polyamine,” (the response) on age (the regressor or predictor).
Here’s our data:
Using R we fit a linear model using the original untransformed data. After that we plot the residuals versus age to check our assumption of homscedasticty:
Look at age 0. Not good. Way too much spread. We can address that problem with a data transformation. Let’s find a good transformation using the method described above. First we find the geometric mean (Note: “level” = Plasma level):
# calculate geometric mean of response
gmean <- exp(mean(log(level)))
Notice we take the arithmetic mean of log transformed plasma levels, and then take the exponential of that. As my professor in grad school told me in his notes, "The advantage of this approach is to avoid a build-up of numerical error."
Now that we have that, we can write a little program in R to loop through values of lambda, transforming our data, fitting a model, and saving our Sum of Squares Error value:
sse <- c()
lambda<-c()
i <- 1
for (lam in seq(-1,1,0.1)){
  if (lam != 0){
  tY <- (level^lam - 1) / (lam*gmean^(lam-1))
  } else {
  tY <- log(level)*gmean
  }
  test <- anova.lm(lm(tY~age))
  sse[i] <- test['Residuals','Sum Sq']
  lambda[i] <- lam
  i <- i+1
}
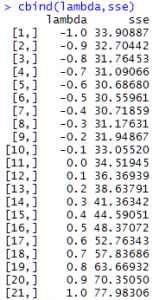
(Notice that when lambda = 0 we have to use a different formula: log (response)*geometric mean.) After we run the program we check the results:
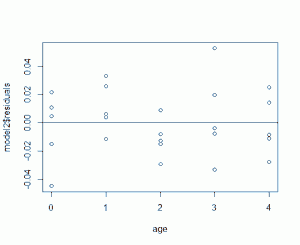
Do we see the lowest SSE value? It's 30.55961, which happens with a lambda value of -0.5. That tells us the optimal transformation is the inverse square-root transformation. So let's transform our response variable using that, re-fit our model and check our plot of residuals versus age:
model2 <- lm(level^(-0.5)~age)
plot(age,model2$residuals)
Now that looks a lot better, especially at age 0. But now that we have a model that was fit with our response data transformed, how does that affect our prediction? It means we need to transform back. The fitted model for the plasma data after transformation is plasma = 0.26803 + 0.04006*age. If we predict the plasma level for age 2.5 we get plasma = 0.36818. Compare that to our data above and you can see that doesn't make any sense. We need to apply the inverse of the inverse square-root to get it back to the original scale: 0.36818^(1/-0.5) = 7.376997. There we go.
Of course use some common sense when applying this method. If the SSE values are pretty close together around, say, 0.4 and 0.5, it may make more practical sense to pick 0.5 (ie, the square-root transformation). Again I quote my grad school professor: "Scientific explanations or even standard conventions often carry more meaning than strict minimization of SSE."
And by the way I should disclose the example above came from a course in Applied Linear Models I took at the University of Virginia. The only difference is the class used SAS. I decided to re-do the example in R.


